Mini Task 3

Do university students conform to gender stereotypes with time spent on activities? This visualisation shows the average hours per day females and males spend on different activities. This data was gathered from 59 university students over the course of one week, where they wrote down activities they participated in every half hour.
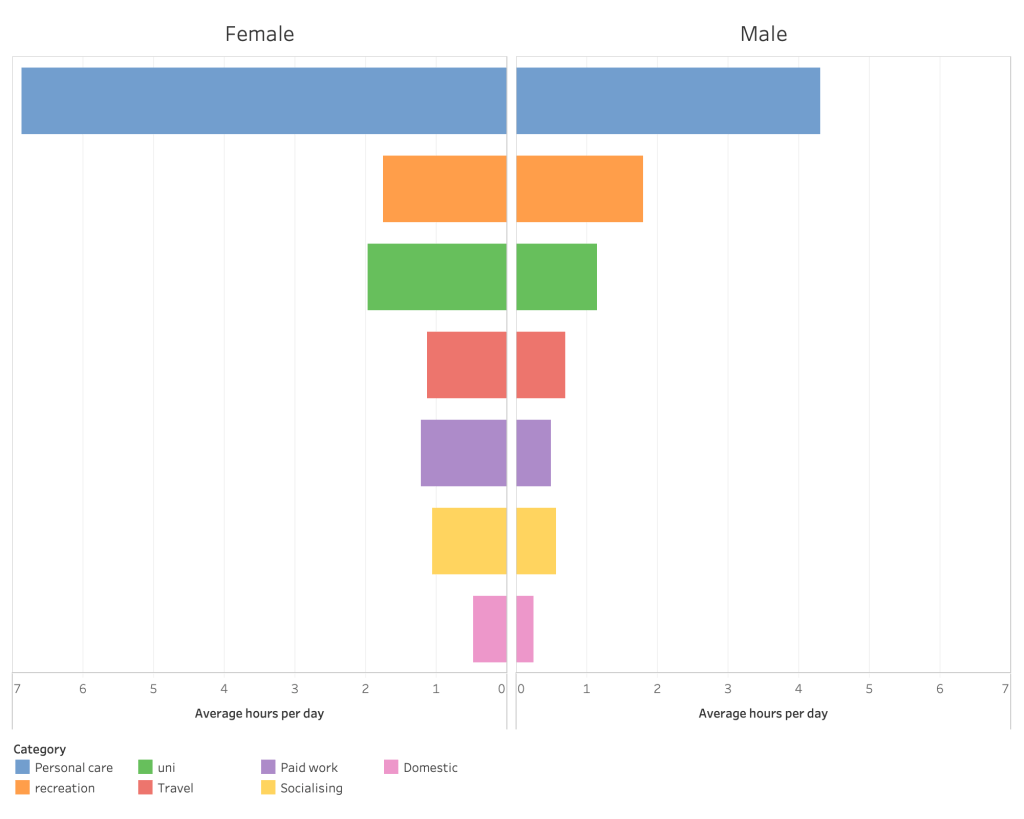
Note: There are more females than males in the sample space, so the results may be inaccurate as a representation of the population.
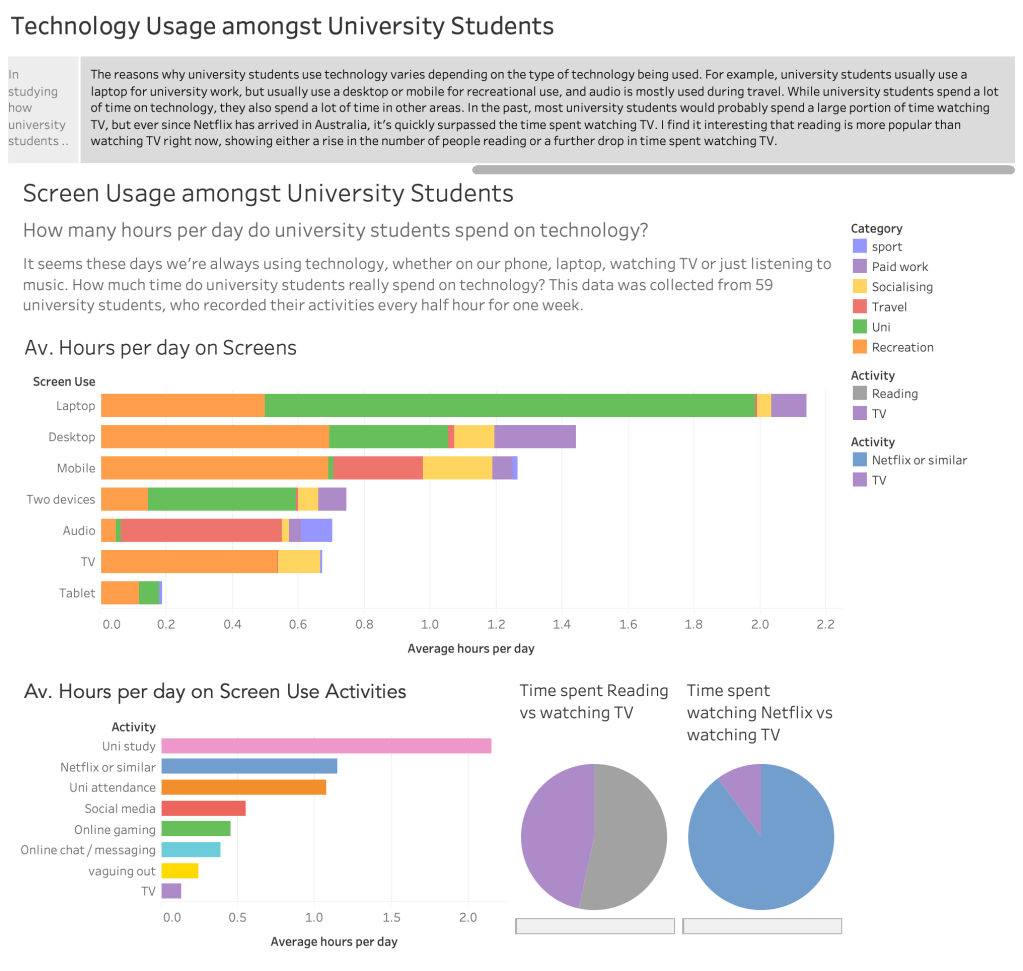
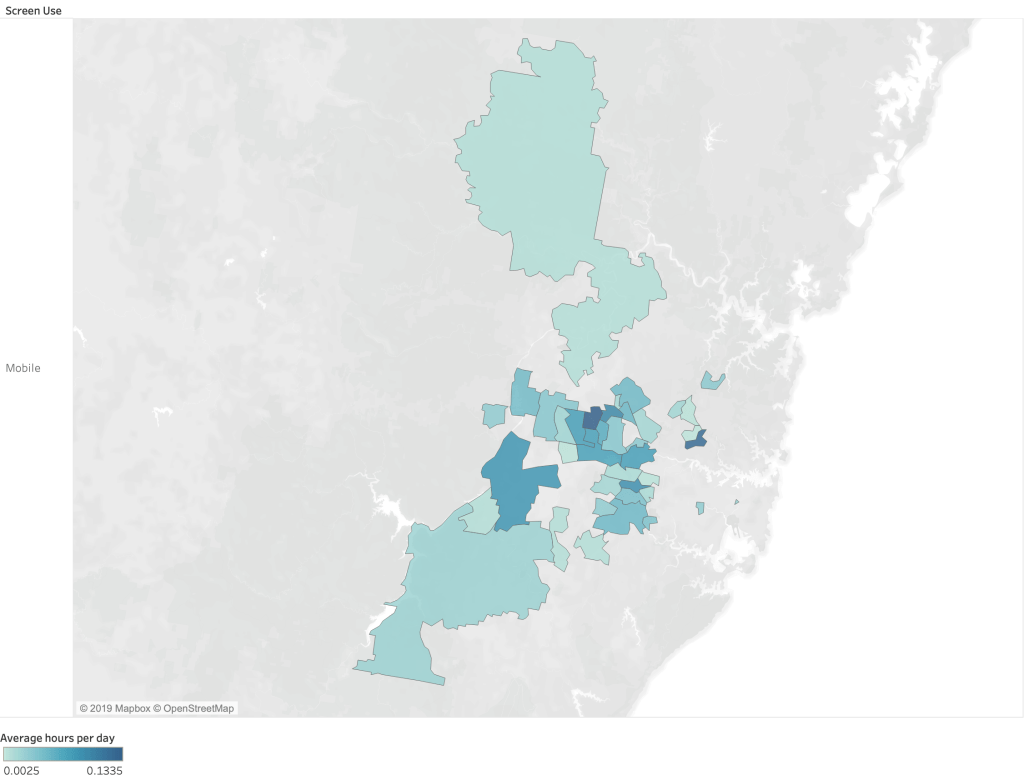
We’re always told to get off our mobile phone, but which suburb uses their phone the most? The following data was gathered over the course of one week by 59 university students, recording their activities every half hour. The heat map was created with Tableau to visualise the areas that recorded the most mobile phone usage.
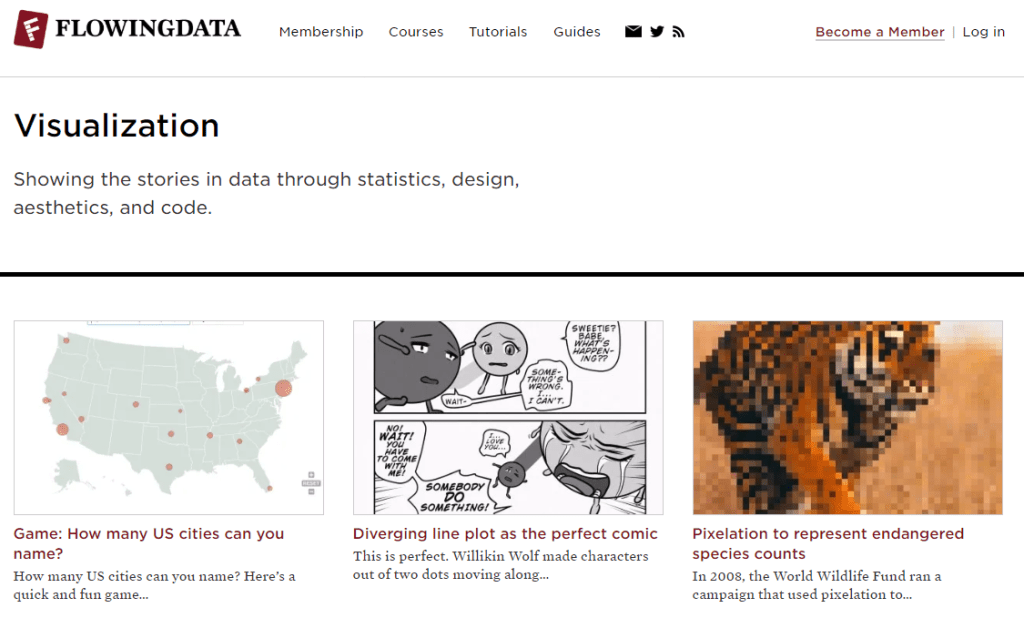
Flowing Data includes many interactive and engaging data visualisations. Many of the visualisations posted are really creative in their design and cover many topics.
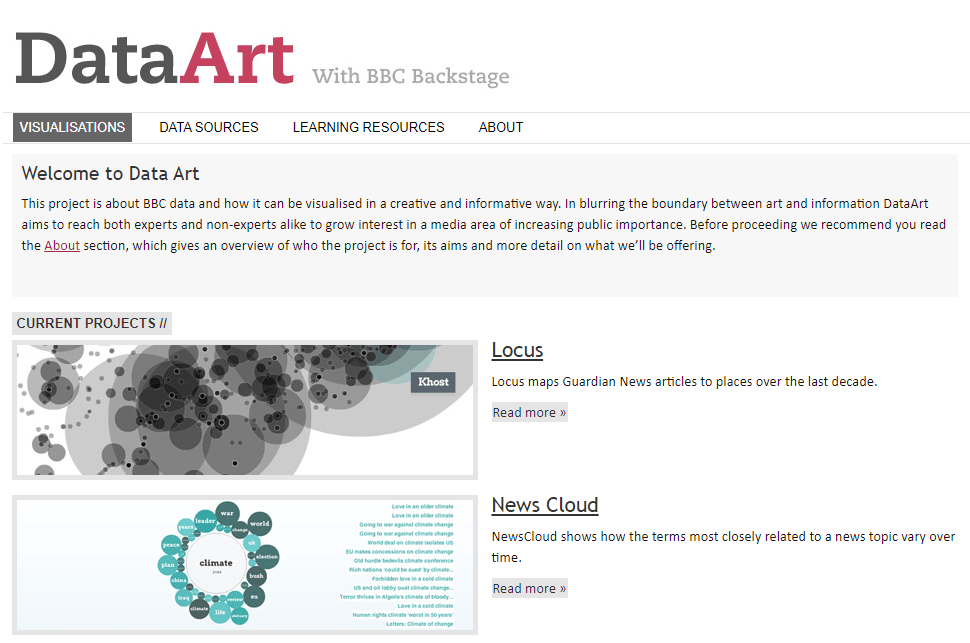
DataArt is a project that uses data from BBC to create beautiful visualisations in creative ways. The visualisations cover current news and world events.
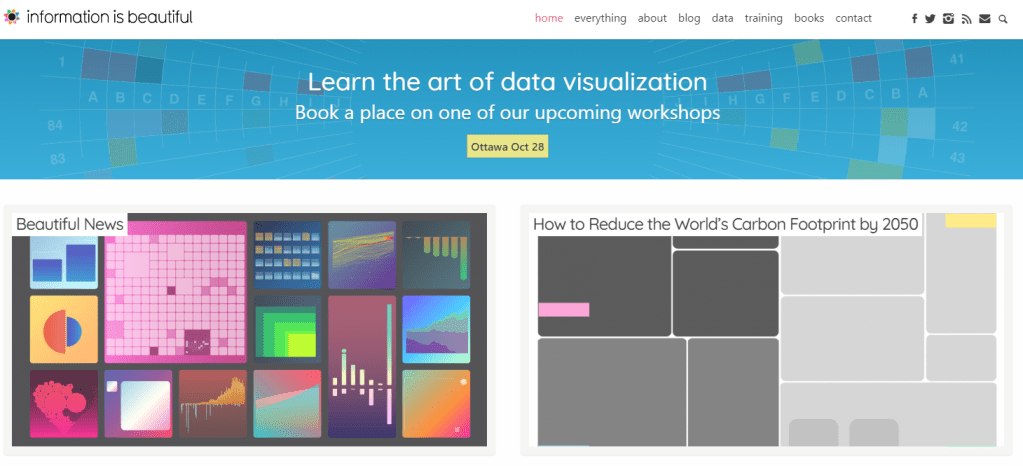
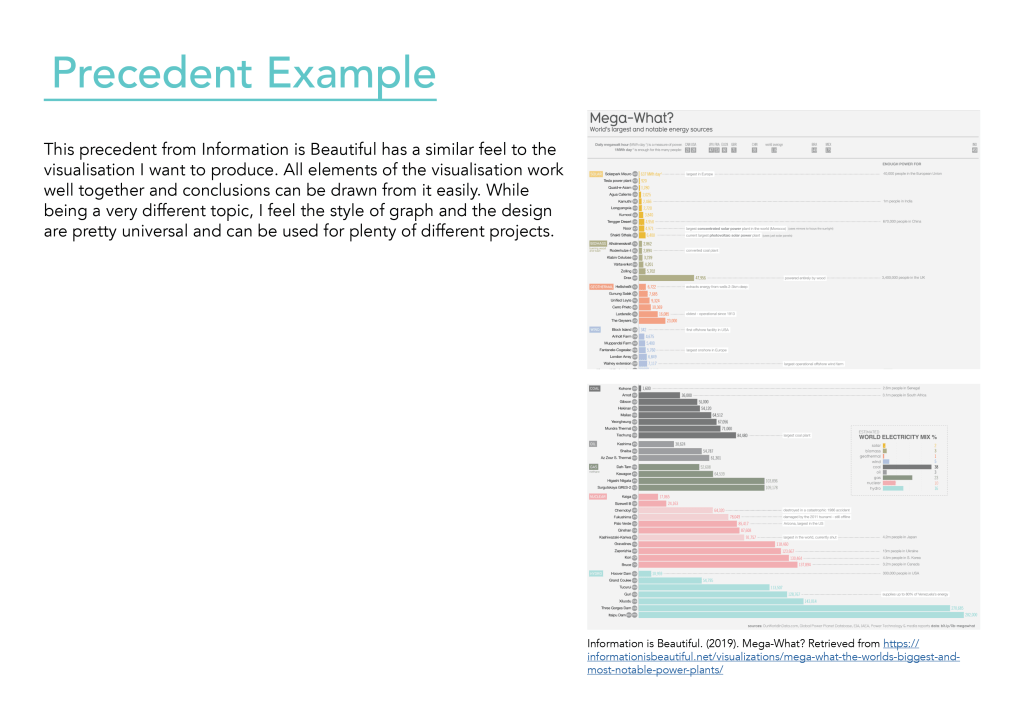
Information is Beautiful shows a collection of data visualisations with unique approaches to design. The colour palettes and styles are particularly inspiring, and are very true to their name.
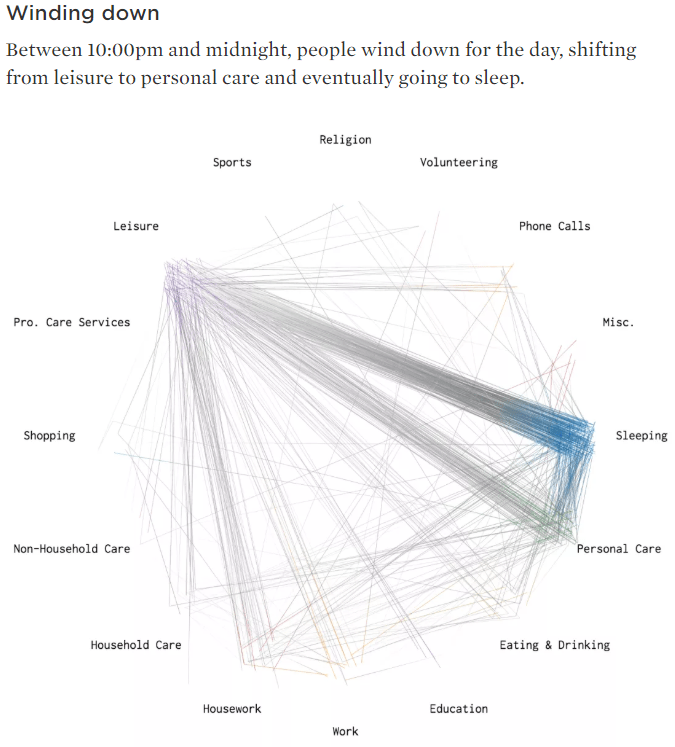
A day in the life of Americans is one visualisation from Flowing Data I particularly found interesting. The visual approach to representing where the population was at a particular time of day has a very pleasing effect, and allows you to easily draw conclusions on what the majority of the population is doing at a particular time.
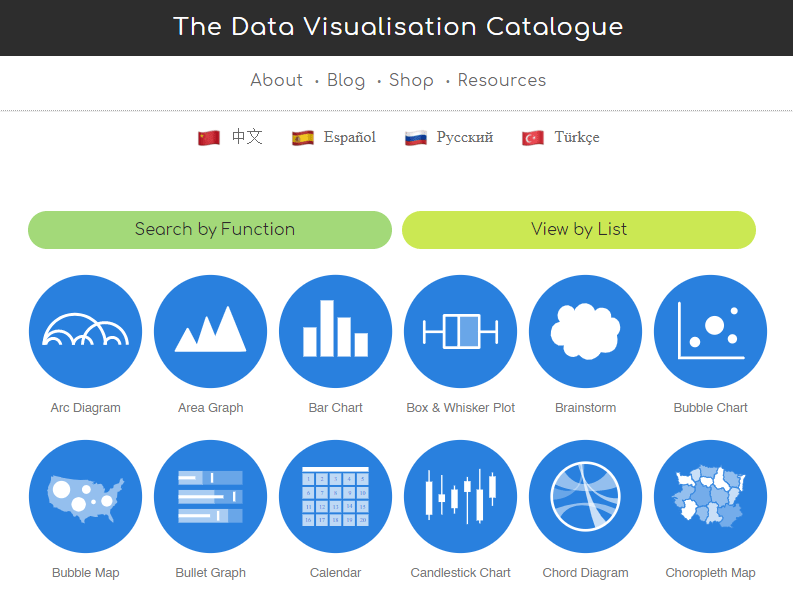
The data visualisation catalogue shows many different ways of visualising data, and gives an explanation of each one. It explains what each graph or chart is good at representing and also covers some potential obstacles when using these methods of visualisation. Examples are also given and guides on how to generate these chart types.
Hi! My name is Carissa and I’m a third year design student. I made this blog to capture my journey as I learn about data visualisation.
I’ve been inspired to pursue design for a long time, with my main interests being in art and science in high school. I hope one day to be able to teach multimedia and science in schools. I particularly enjoy illustrating, animation, app and game development and designing for print.
This blog follows my journey as I learn all about data visualisation, and includes my notes on the lectures, my classwork and some helpful links to great examples of data visualisation.

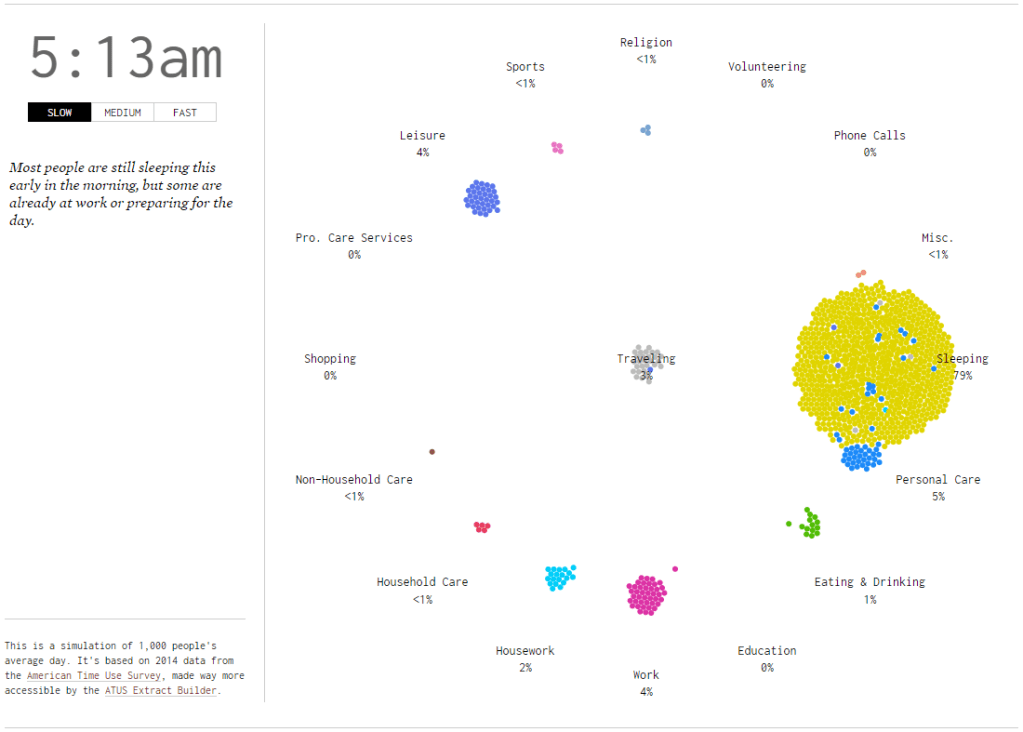
A day in the life of Americans shows am average of how Americans are spending their time each day to the minute.
The visualisation uses time-based motion graphics to simulate what activities people are participating through the day. Activities are separated into categories. There are 1000 bubbles to represent the American population. Bubbles move to a category each minute to represent what percentage of people are participating in that activity at the current time.
The reader has the ability to change the speed at which time progresses, with the option of slow, medium or fast. The visualisation itself does not go into much detail, however another link on the page takes you to another visualisation exploring the same data.
Yes. You are able to create multiple stories from the percentages of people participating in different activities. For example, at 4am majority of people are sleeping, but by 9am majority are working. You can guess what time of day it is purely by what activity majority of people are participating in.
The visual design is aesthetically pleasing. It’s flat and minimalistic, which is essential when considering 3 different variables and allowing information to be easily distinguishable and read. For the most part, the layout is spaced out enough that it’s clear what bubbles are in which category, and the time and controls aren’t so far that they feel separate. The colours all work well together, and similar colours are spaced in a way that they’re easily distinguishable from each other. The typography is light and unobtrusive to the rest of the visualisation, while still being readable. The font chosen is a serif monospace typeface, which reflects old style statistics and factual information. The choice of visualisation works well to visualise people moving from place to place, and the circular format is evenly spaced.
To improve the visualisation, I would suggest giving the reader more control over the time in the simulation, to be able to skip forwards or backwards in time or to pause at certain times. Also giving the reader the option to filter certain categories would also be helpful. Sometimes in the visualisation the bubbles appear to be in the wrong categories, which is unclear what it is trying to represent. This could represent multitasking, or bubbles could be getting stuck in the wrong categories, giving inaccurate representations of the percentages of people participating in certain activities. Also, when large amounts of people are doing one activity, such as sleeping, it clashes into other categories like personal care. I would suggest expanding the distance between the categories to help with this. Another improvement could be to expand the data over a week rather than one day, to give more information about time use and compare weekdays to weekends. Another idea might be to bring some of the author’s other visualisations together to be able to compare similar data sets.
The data used comes from the American Time Use Survey from 2014. It was conducted by the US Census Bureau, so the source is reliable but slightly outdated. The source also confines the data to the United States, so it would be interesting to see similar data sets for other countries.
