Data Visualisation

Menu

Skip to content
  • Home
  • About
  • Lecture Notes
  • Analysis of a Data Visualisation
  • Classwork
  • Links

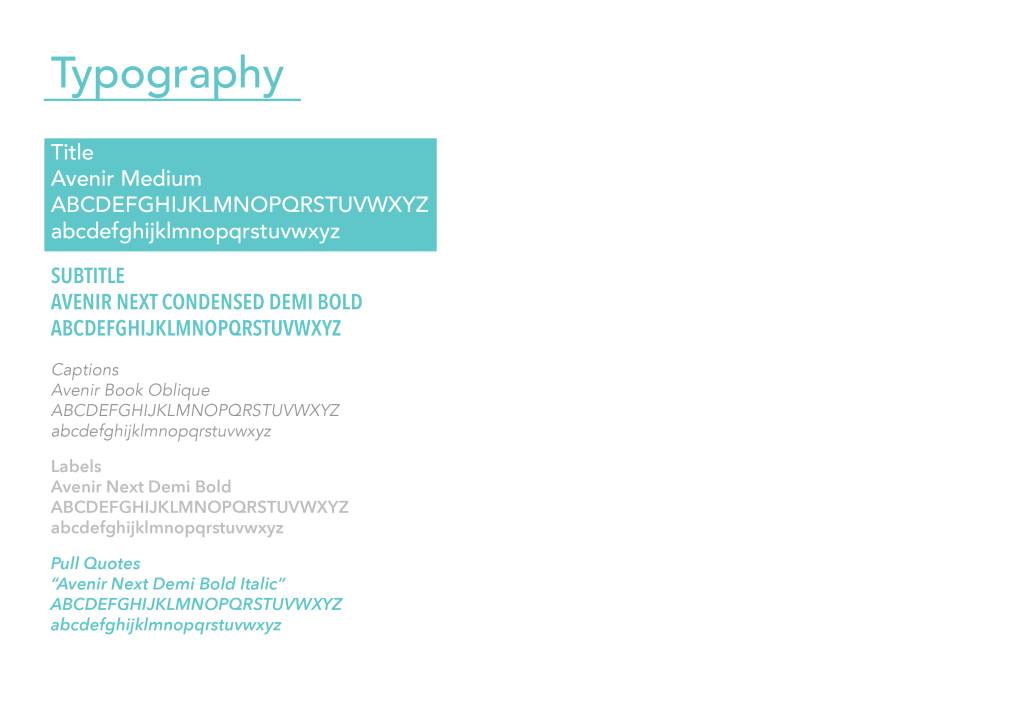
Typography

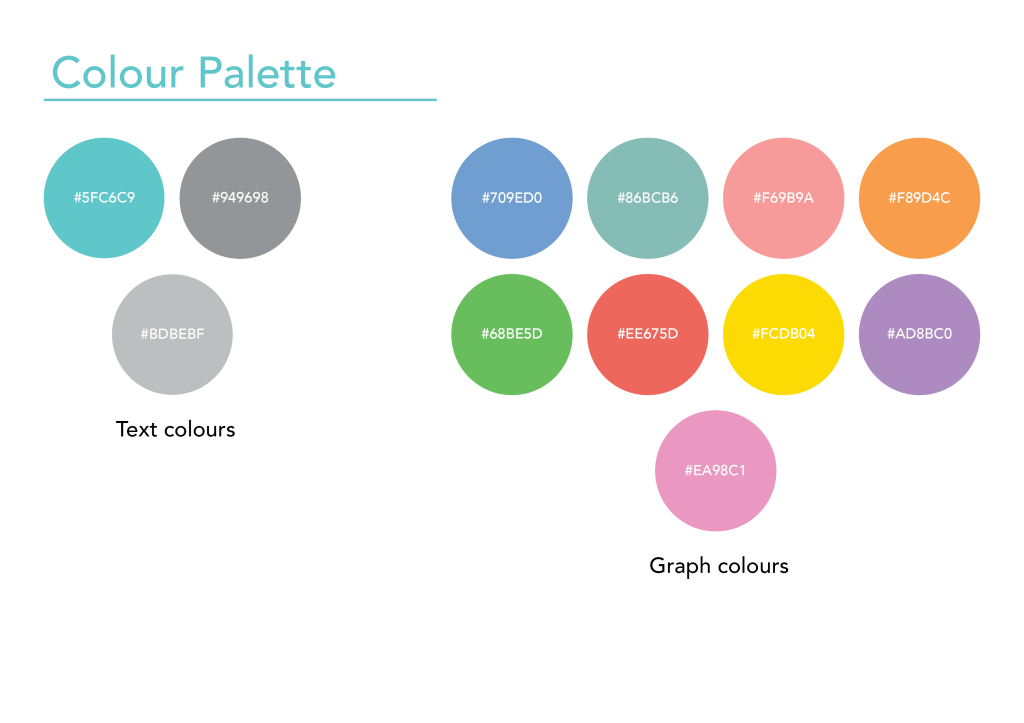
Week 12: Style Guide

Classwork

Mini Task 3

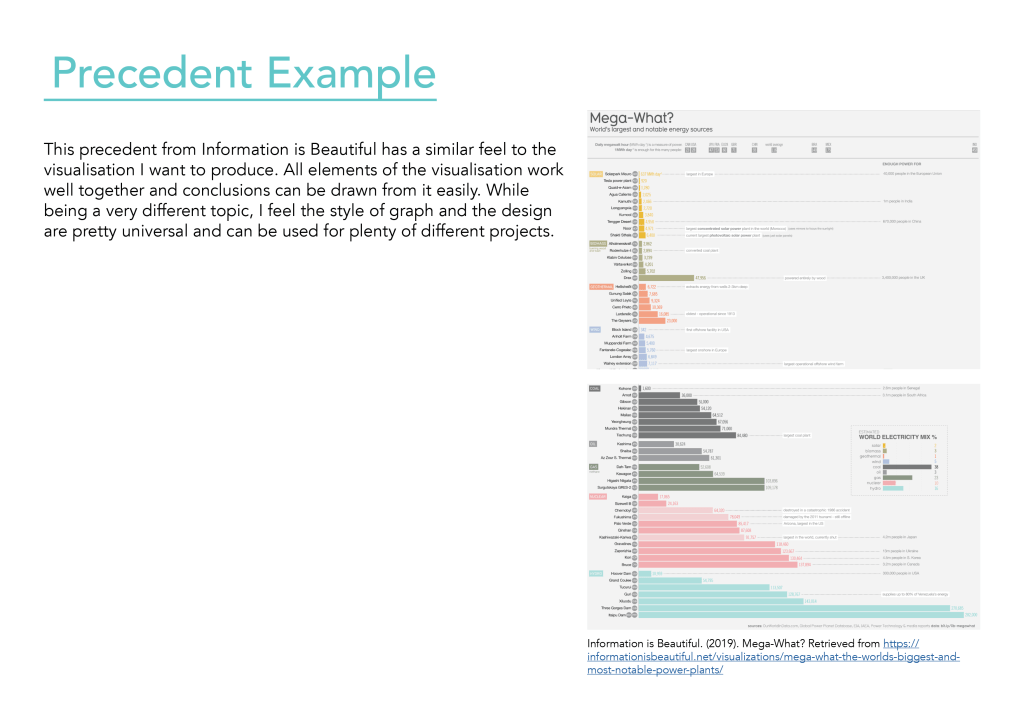
Information is Beautiful. (2019). Mega-What? Retrieved from https://informationisbeautiful.net/visualizations/mega-what-the-worlds-biggest-and-most-notable-power-plants/
October 5, 2019October 5, 2019 luvbuneez10 Tagged Colour Palette, Data, Grid, Layout, Style Guide, Typography, Visualisation Leave a comment
Website Built with WordPress.com.
Privacy & Cookies: This site uses cookies. By continuing to use this website, you agree to their use.
To find out more, including how to control cookies, see here: Cookie Policy
  • Subscribe Subscribed
    Data Visualisation

    Have a WordPress.com account? Log in now.

  • Data Visualisation
    View site in Reader
    Manage subscriptionsSign upLog in
    Report this content
    Collapse this bar
Loading Comments...
Create your own website, free on WordPress.com.Create your own website.
Start free