Mini Task 1
Mini Task 2

Do university students conform to gender stereotypes with time spent on activities? This visualisation shows the average hours per day females and males spend on different activities. This data was gathered from 59 university students over the course of one week, where they wrote down activities they participated in every half hour.
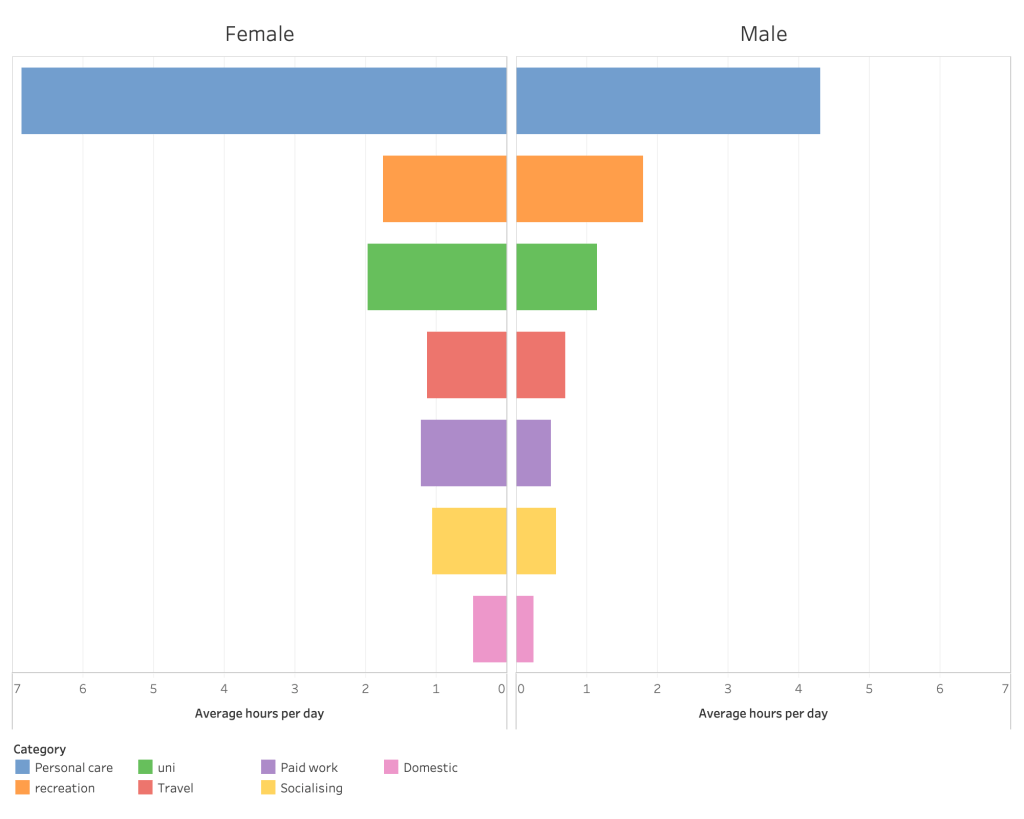
Note: There are more females than males in the sample space, so the results may be inaccurate as a representation of the population.
