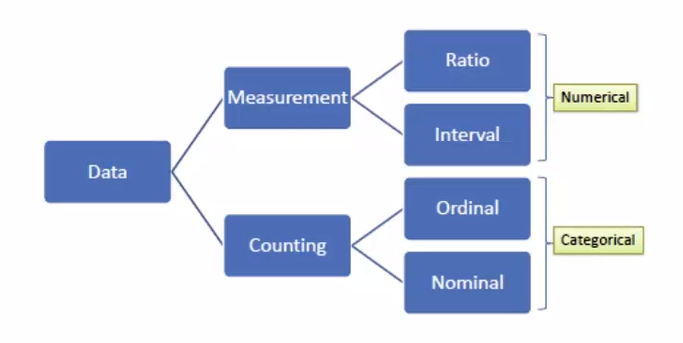
Data Types
- Nominal: Pertaining to names. For example, section of store different items are found in. Usually not ordered, categories. Can be counted and percentages can be found, but you cannot find an average.
- Dichotomous: When there are only 2 categories, such as yes or no questions. Eg. Are carrots on sale? The answer can only be yes or no, making it dichotomous.
- Ordinal: Ordered. Eg. Scales such as strongly disagree to strongly agree. No mathematical value, but numbers can be assigned to make the data entry easier. Any set of numbers can be used as long as they are in order. Can also calculate percentage.
- Interval: Interval between each consecutive point of measurement is equal to each other. Eg. The time between 1pm and 1:30pm is the same as the time between 1:30pm and 2pm. Data is numeric and mathematical operations can be performed on it, but there isn’t a meaningful 0 point. When the value reaches 0 it doesn’t indicate the absence of what is being recorded. Eg. 0am means the start of the day rather than the absence of time. Calendars and temperatures are also interval data.
- Ratio: Numeric, and similar to interval data but there is a meaningful 0 point. In ratio data, a measurement of 0 represents the absence of what is being measured. Eg. 0 people waiting in a line. Other examples include weight, height and money.
Qualitative and Quantitative data
- Qualitative data includes descriptive information. It is non-numeric data. Eg. “I drink coffee every day.”
- Quantitative data is numeric, and can be quantified. Eg. “I drink 2 coffees every day.” Interval and ratio data are always considered quantitative.
